Marketing
Marketing
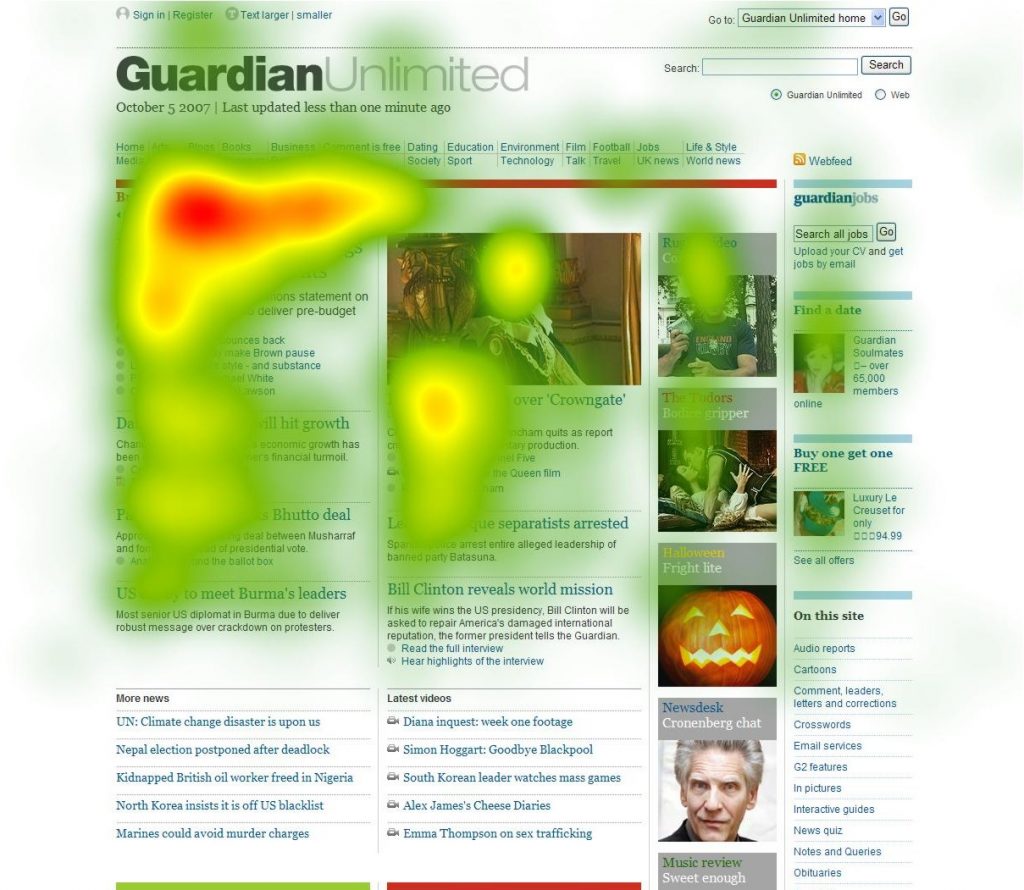
Heat maps are nifty visual overlays that help you to get into the head of your average website visitor and see how and why they’re behaving on your web pages in a certain way. It looks like an infrared display and takes website data and uses colour and hotspots to indicate high and low activity in certain places on your website. Red is ‘hot’ and shows lots of interaction and colder spots are blue.
This type of tool can nail ‘customer behaviour’ and helps you to build a website that has your customer in mind and is designed with data-driven insight. So how can handy heat maps increase your website conversion rate?
You can go into very specific detail with heat maps and they can give you an insight into what your customer is doing on your website. Click heat maps are the most basic model and they literally show you where people are clicking most on your web pages. Eye-tracking heat maps get a bit more advanced and can track things like cursor movements and then determine a sequential path customers are taking and an entire subset of users’ movements. Then we’ve got scroll-tracking heat maps that are really useful for determining visual space and can show things like whether people are viewing info ‘below the fold’.
You can determine the aggregated points that are shown, so whether you want to look at daily, weekly or monthly trends is up to you.
The best way to increase conversion is to improve your customers’ user experience on your website. There’s no need to speculate about your user design or layout because you can use data to explore what works.
Heat maps allow you to see whether people are easily navigating their way through a customer journey. You can tell whether they are responding to your calls to action; are there things that are distracting people from visiting certain pages and converting; are pages too cluttered and content too long; are you making the most of upper-left and left-hand side spaces that visitors look at more?

Split testing with data from your heat maps is a great way to test out all of your ideas and make a seamless user experience. And you can also use heat maps in conjunction with other metrics and analytics to build a bigger, bolder picture of how customers are interacting with your website.
An eye-tracking heat map allows you to see where people are moving their cursors and whether they’re stopping to read your content too. This can help you to decide what content is most useful to your audience and what type of content they like to view. Find out which point people are abandoning your content at and cater the length of posts or where to insert calls to action.
Uncluttering your website and making it streamlined and simple can help to guide people towards your content and calls to action. Heat maps can show what is getting the most attention on your page and if it’s not useful for conversion purposes then you can tweak elements to make your overall website more effective.
Heat maps can help you to decide which images, banners or visuals on your website are helping or hindering conversion. You can use split testing to try out different images and find images that complement the user journey, instead of distracting from it.
Heat maps are an insightful, data-driven way of being able to monitor and improve people’s user experience on your website. They’re even more super useful when combined with other analytical tools. You can effectively reorganise your website’s digital infrastructure and make an easier, more pleasant experience for your potential customers. Lovely!
Sound off below, we’d love to hear your insights.


Stay up to date with the latest marketing, web design, and branding tips and news.