Marketing
Marketing
Digging into metrics such as reach, impressions, likes, comments, shares and page views is a crucial part of refining your social media strategy.
By tracking metrics such as these, you’ll be able to better understand the effectiveness of your strategy, see where you’re falling short and start setting new goals for the future.
But where to start? Here are the three most important metrics to have a handle on when analysing your social media content:
This is an obvious one. In fact, it’s so obvious that some people tend to conflate all social media metrics with engagement (hint: this isn’t the case).

Engagement is specifically concerned with actions that your readers take having seen your content, such as likes, shares, comments, reacts, retweets, etc.
Engagement metrics are the most representative of how much of an impact your content has had on your followers. They indicate whether or not your content is resonating with people.
Low engagement metrics mean going back to the drawing board for some fresh topics of conversation or ways of presenting your content.
High engagement rates mean that you’ve struck upon gold.
Make notes on what you believe people have connected with in your content with high engagement rates.
Not only will this help you to keep producing content in the same vein, it will also give you a greater understanding of your followers.

When analysing your engagement per piece of content, you need to work out your average rate by adding up all of the interactions your followers have had with that content (likes, comments, shares etc.) and divide this number by your total number of followers.
Multiply this by 100 to get your average engagement rate percentage.
Don’t be discouraged if this number seems quite low.
Facebook and Twitter have notoriously low engagement rates, roughly around 0.5 to 1%. Instagram has the highest rates of engagement out of all social media platforms and yet that’s still only between 3-6%.
Anything higher than this and you’re doing amazingly!
We’ve touched on reach and impressions before, but if you missed out on any of our pearls of wisdom don’t worry, we’ll fill you in.
These two metrics are both helpful to keep track of when analysing the results of social media campaigns and setting goals for the future.
But they can be a bit difficult to understand in relation to one another when you’re first getting to grips with your social media strategy.
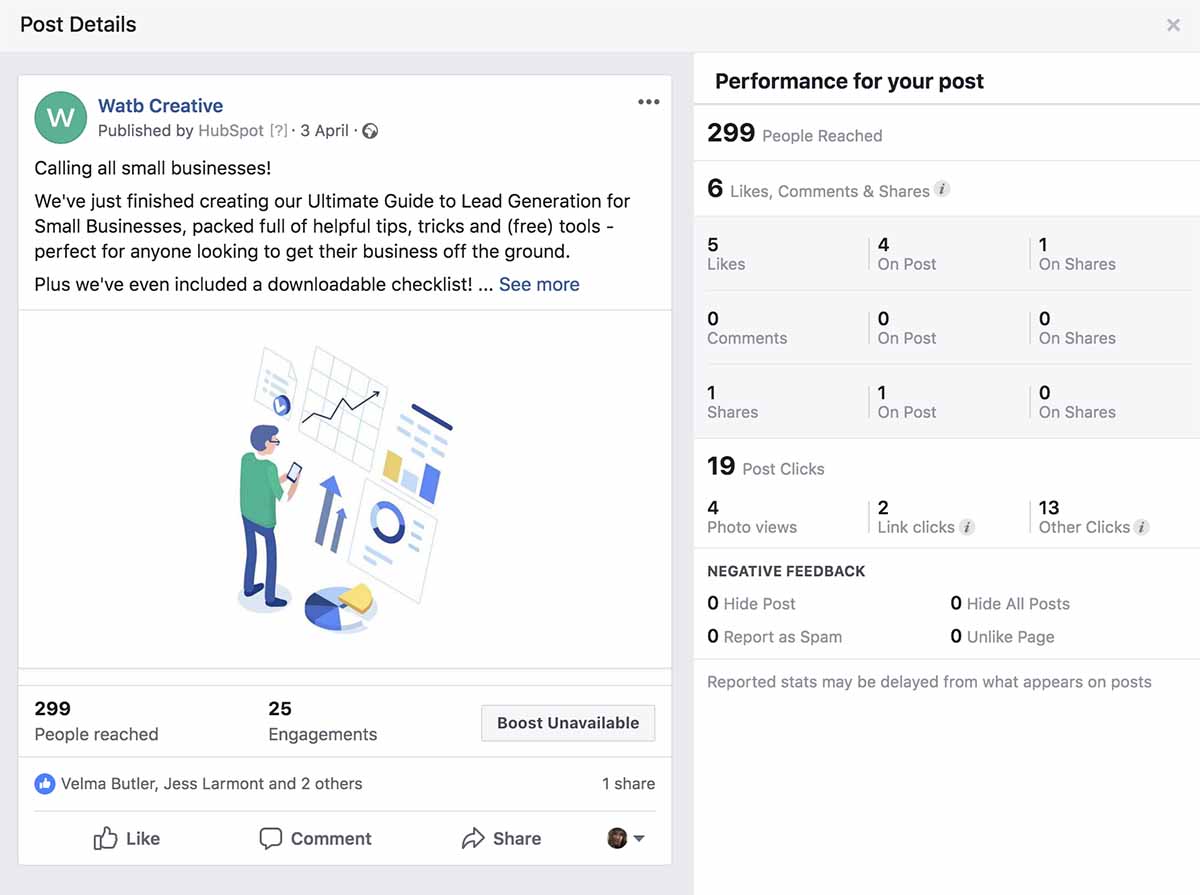
Reach is the number of unique accounts that have been exposed to a piece of content you’ve posted on social media.
Impressions are the number of times that post was delivered to users’ feeds - regardless of whether those users engaged with it or whether they’d seen it before.
This might seem a bit confusing to begin with. Those two definitions sounds pretty similar at a first glance.
Well, the important distinction to keep in mind is that reach is about how many unique accounts have had your content appear in their newsfeed, whereas impressions are not unique to one user.
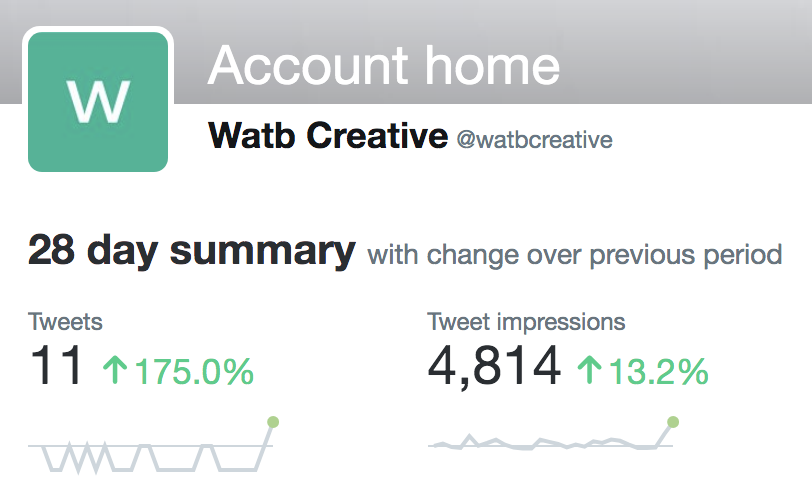
Some posts can be shown to users multiple times and therefore would count as more than one impression.
For example, if you see a post by a page that you follow on Facebook and then see it again in your newsfeed because it’s been re-shared by a friend of yours, that would count as two impressions but would only have a reach of one.
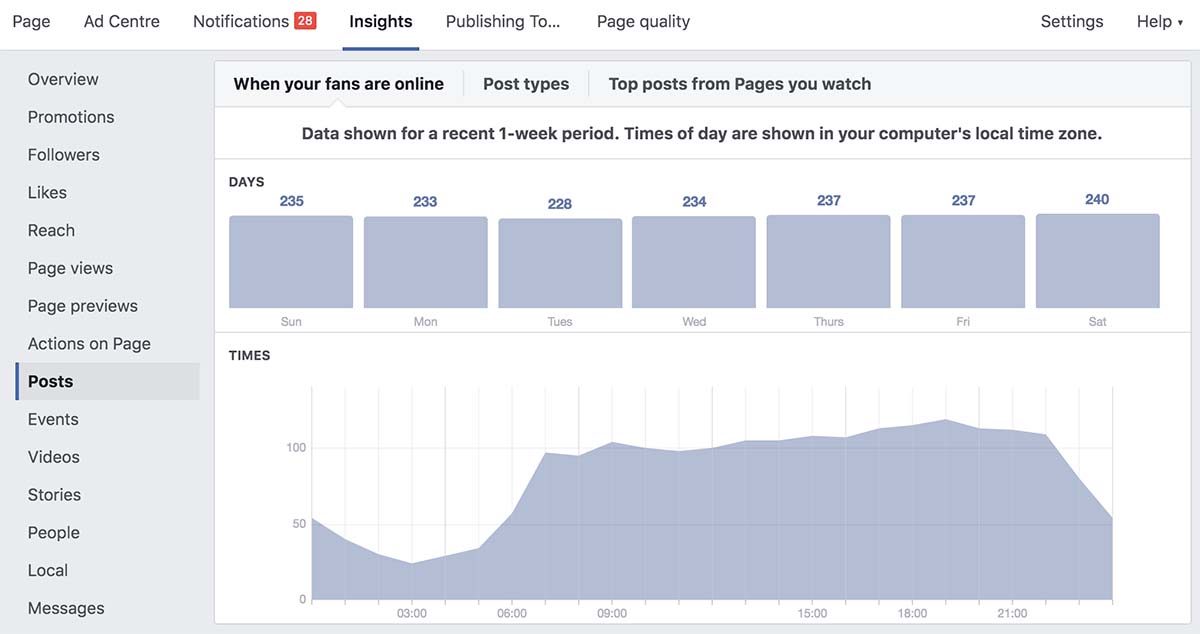
To increase your reach and/or impressions, try to find out when your followers are most likely to be online in order for the maximum amount of people to be able to potentially see your content.
There’s a lot of debate about the best times to post on social media but ultimately, nothing is going to be as helpful as your own analytics for determining when your followers are online.
On Facebook you can find this information in Page > Insights > Posts > When your fans are online.
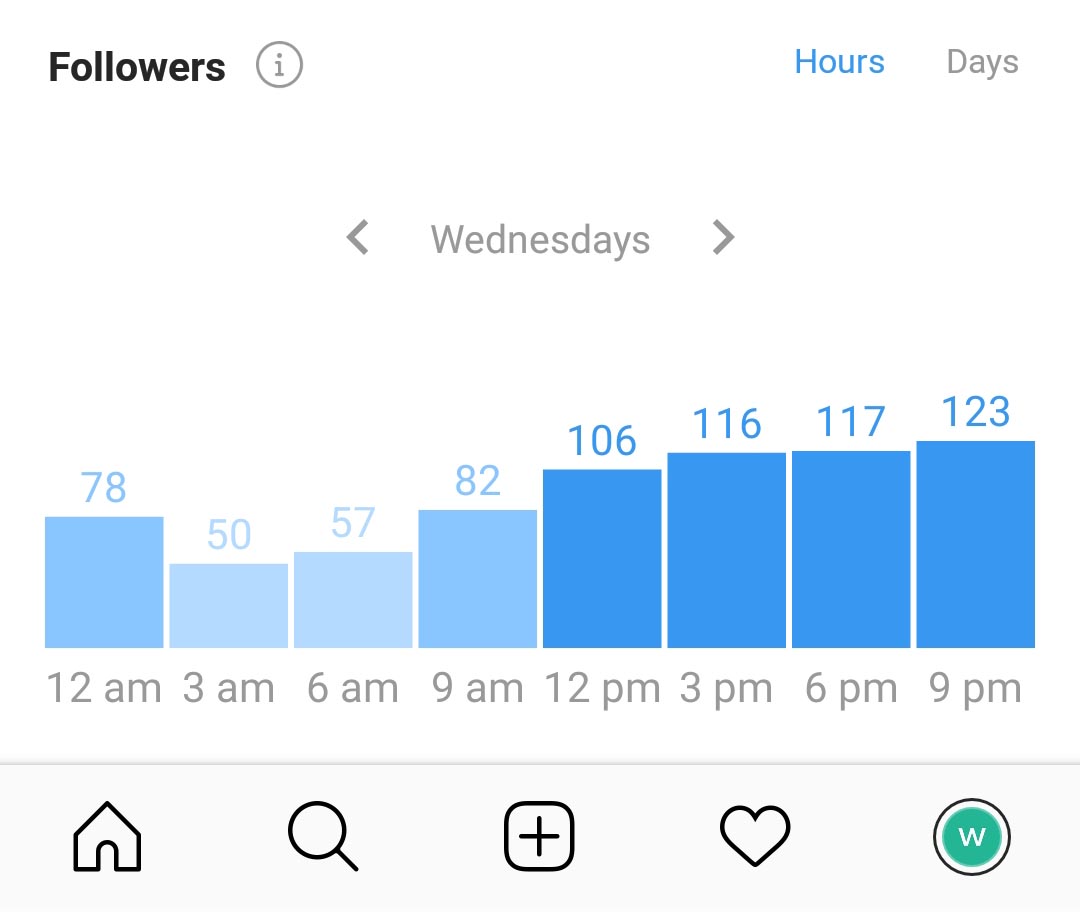
On Instagram you can find this in Insights > Audience > Followers. You can view the times that your followers are online either by Hours or Days by switching between these two tabs.
Twitter and LinkedIn unfortunately don’t have this information in their Analytics.

Download this handy content calendar to make note of all of the social media holidays to watch in 2019.

Profile views aren’t talked about quite as much as many other social media metrics but they’re super useful for small businesses to track whether any new potential leads might crop up via social media.
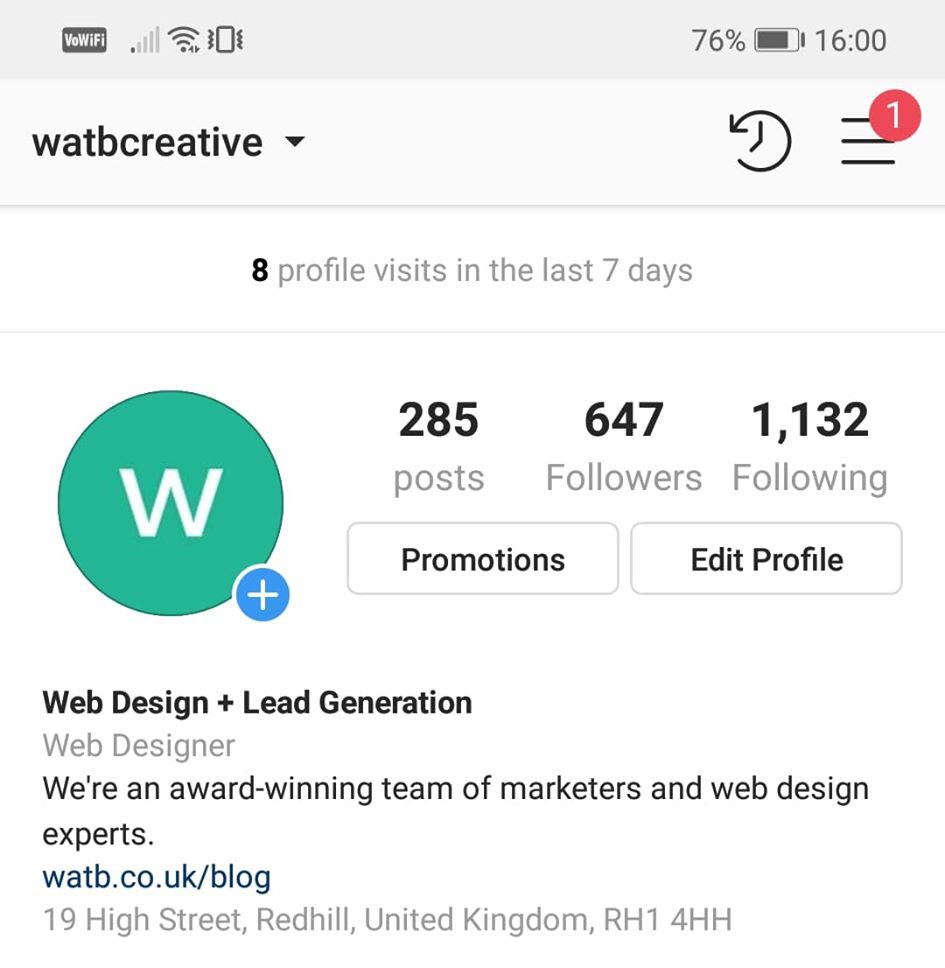
In a way, profile views are similar to click-through rates. They indicate that you’ve piqued someone’s interest enough that they wanted to search out more information about you or see more of your content.
That makes them somewhat of a warm lead in need of nurturing.
If you’re seeing high profile views but low engagement rates, it’s clear that the rest of the content on your profile isn’t up to scratch and should be curated a bit more carefully.
Low profile views (even with high engagement rates) mean that your content isn’t converting enough users into potential leads.
In cases such as this, it might be useful to find a way to direct users to your profile with a call-to-action.
For example, telling followers to check out a link that you’ve put in your bio on Instagram is a tried and true way of getting more eyes on your profile.
Not only does your profile showcase more of your fabulous work, it also includes a link to your website and even your phone number, making it all the more easy for visitors to get in touch with you.
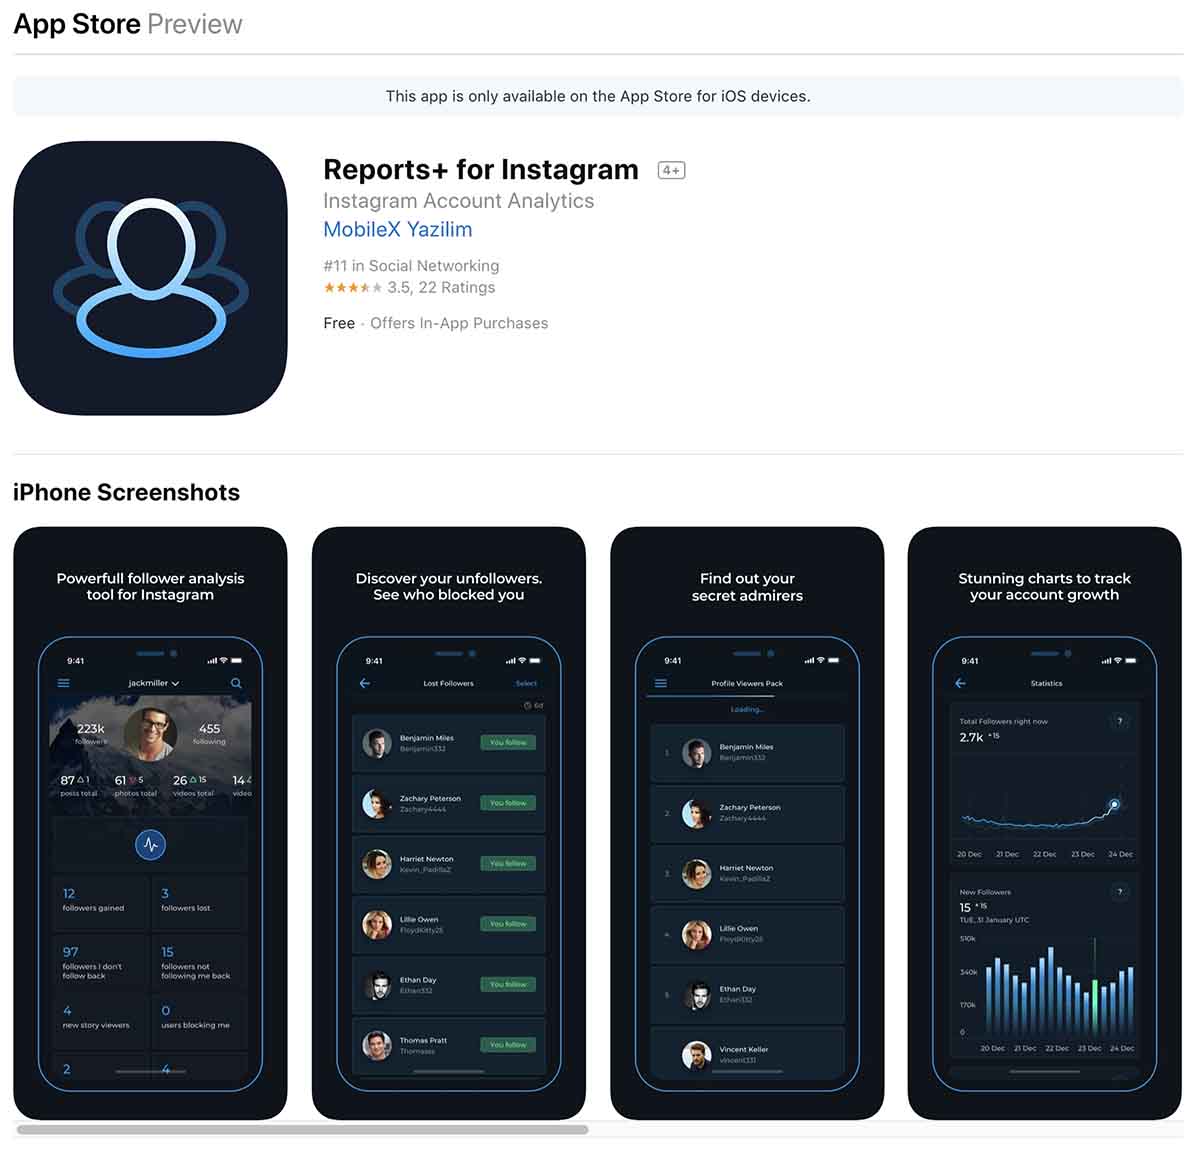
If you really want to get serious about chasing up potential leads via social media then you might want to use certain apps or extensions to help track exactly where those profile views have come from.
But beware, there are many fraudulent apps and plug-ins that claim to allow you to see who’s been viewing your profile, but really they just collect your personal data and sell it or infect your computer with malware.
Other legit apps such as InstaReport, Social Track and Social Fans can unfortunately come with a heavy price tag and inaccurate reports. Make sure to do your research before downloading any of these apps.
By tracking these three metrics, you can tweak your social media strategy bit by bit to keep improving over time.
Make sure you set aside time to record the results of your analytics as many social media platforms only store information for up to 28 days.
It’s important to consistently measure these analytics in order to develop a detailed picture of your areas of weakness and strength.
And don’t sweat the small stuff!
It’s natural for your analytics to have peaks and troughs. As long as you delve into the reasons why you’re having a dip, you’ll be able to course correct and continue to see growth in the long run.
Download this handy content calendar to make note of all of the social media holidays to watch in 2019.


Stay up to date with the latest marketing, web design, and branding tips and news.